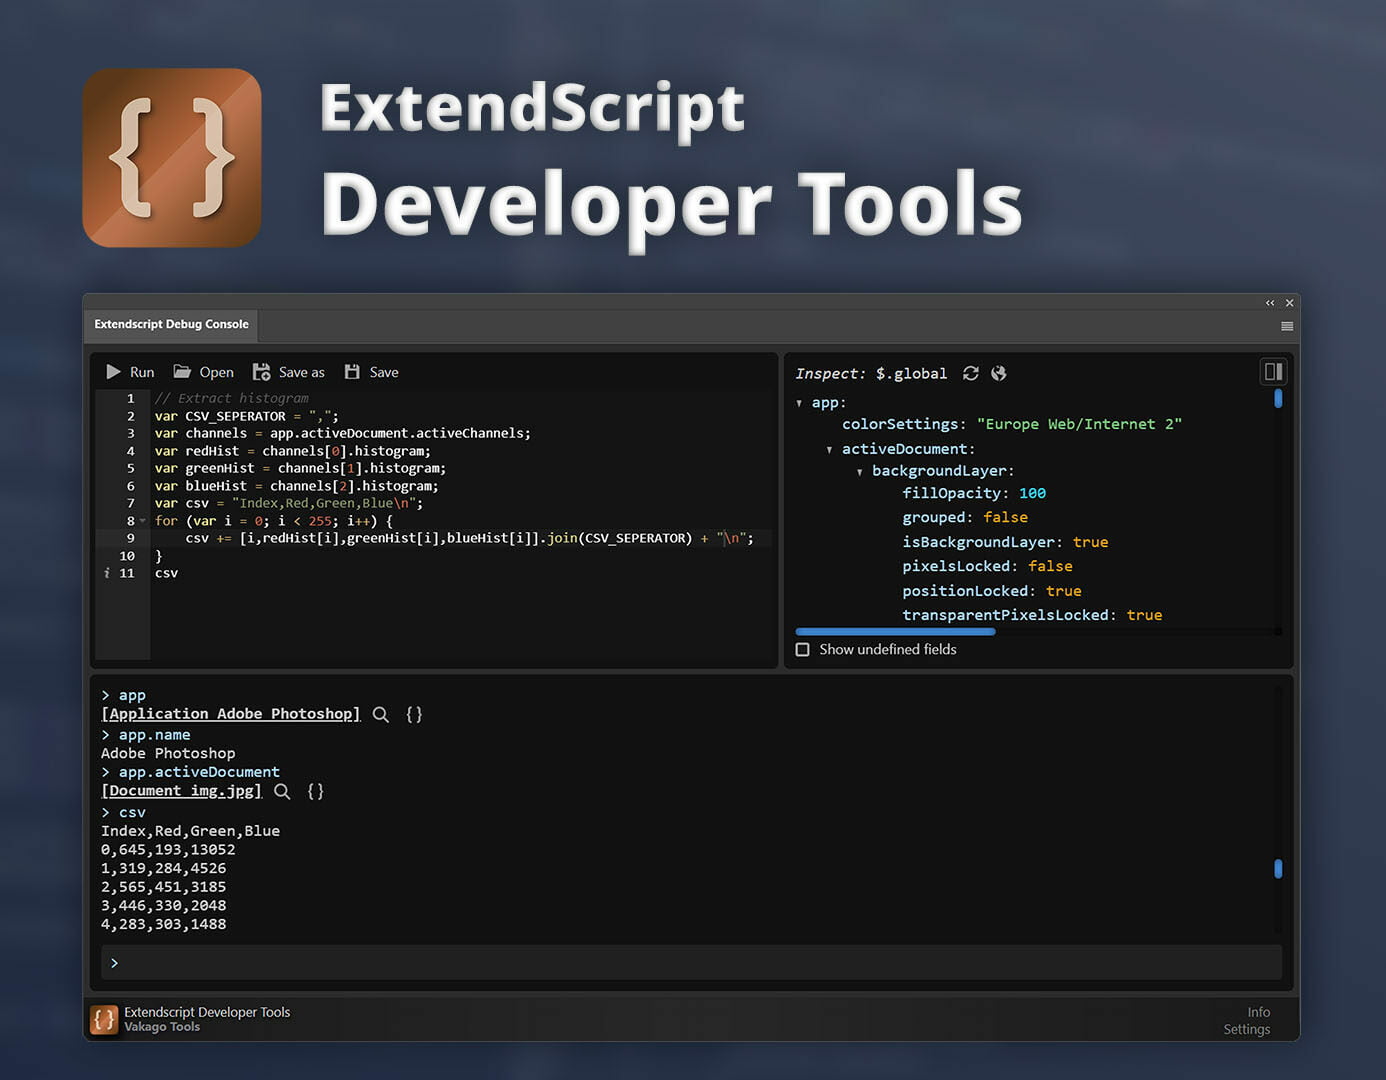
A common issue when developing extensions for the Adobe Creative Cloud applications is that debugging ExtendScript is rather cumbersome. The integrated debugging tools only allow debugging the client-sided CEP code. Therefore developers usually resort to either using the ExtendScript Toolkit CC or to using Visual Studio Code with the ExtendScript debugger plugin installed. In this article, we’ll have a look at another useful extension: The ExtendScript Developer Tools allow running ExtendScript commands from within an extension in most Adobe applications. This enables you to test ExtendScript commands or even run whole JSX files without having to reload them. It also enables you to inspect the adobe API as well as variables and functions of loaded extensions.
ExtendScript Developer Tools
This article deals with the ExtendScript Developer Tools plugin for the Adobe Creative Cloud applications. Use below buttons to learn more.
Running ExtendScript Commands
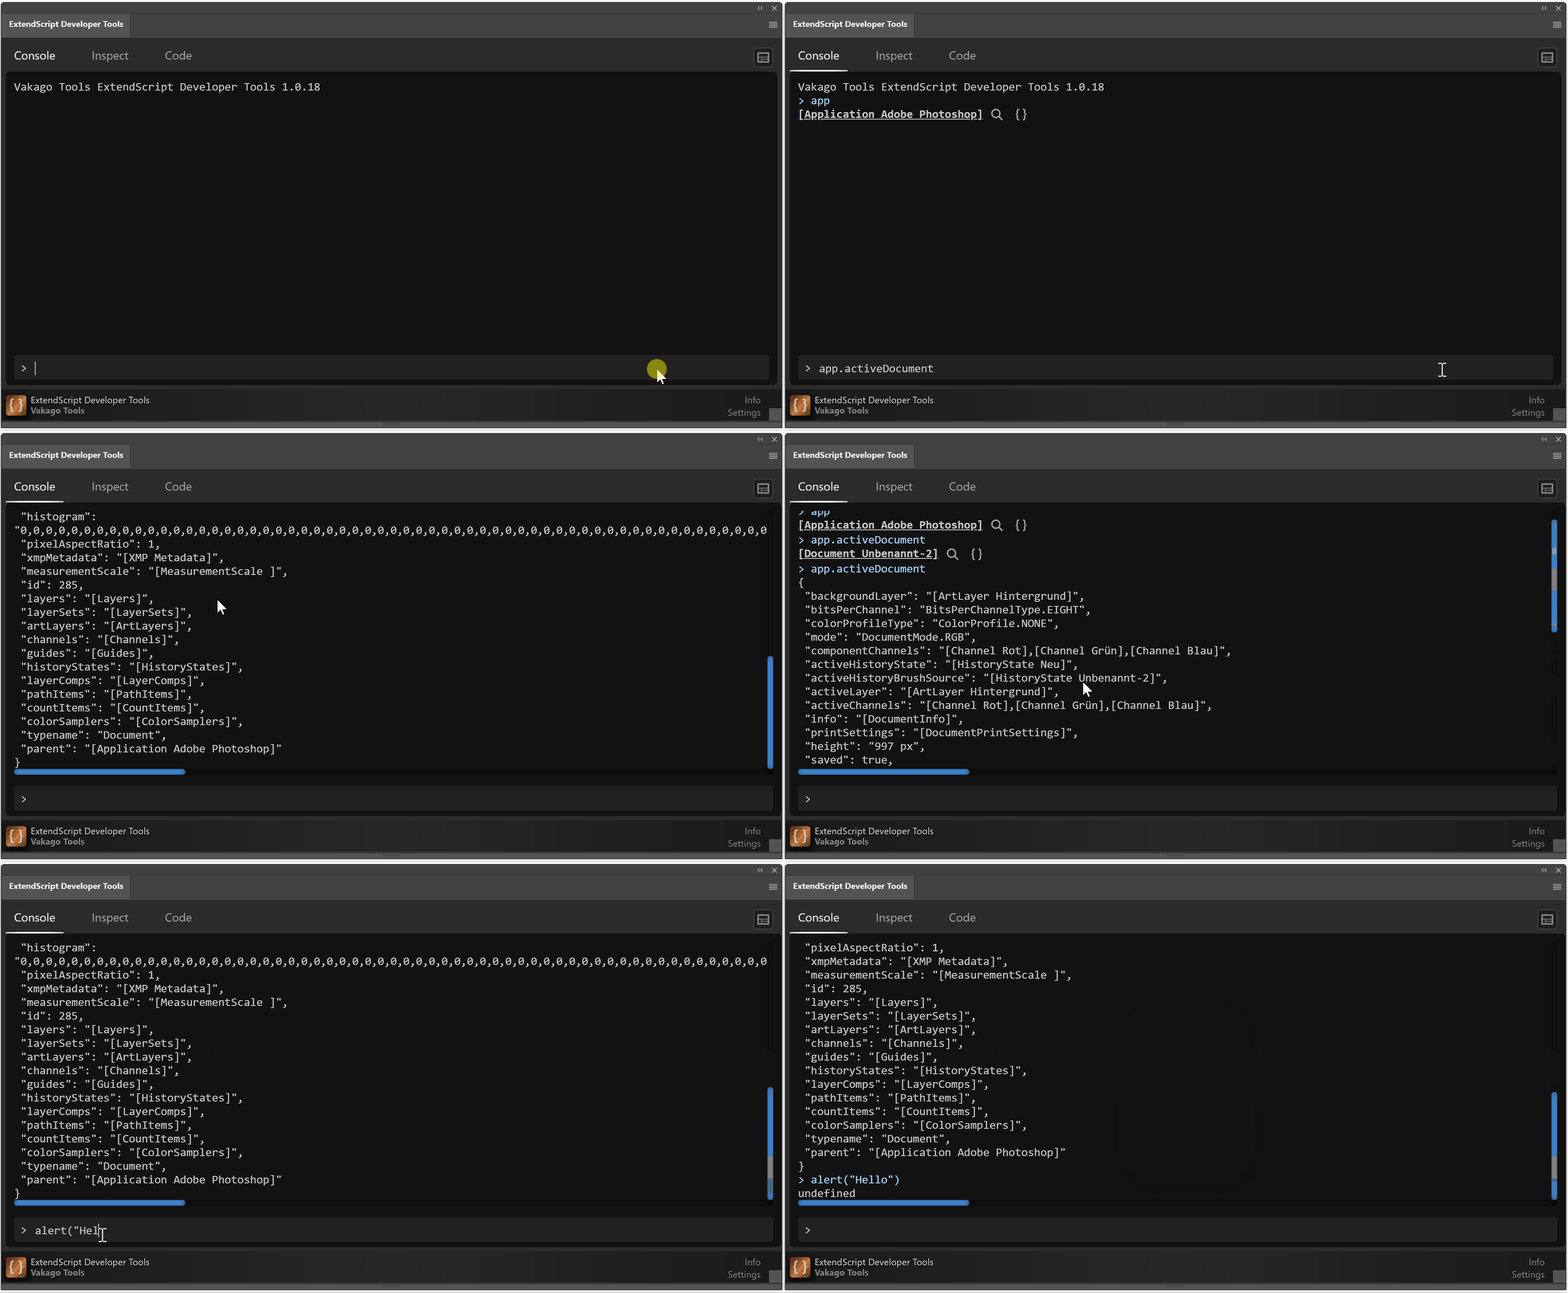
The Extendscript Developer Console allows executing any ExtendScript command such as app.activeDocument in Photoshop or app.setSDKEventMessage(text, level) in Premiere Pro. In the following screencast you can see the debug console functionality in action:
Inspecting Variables
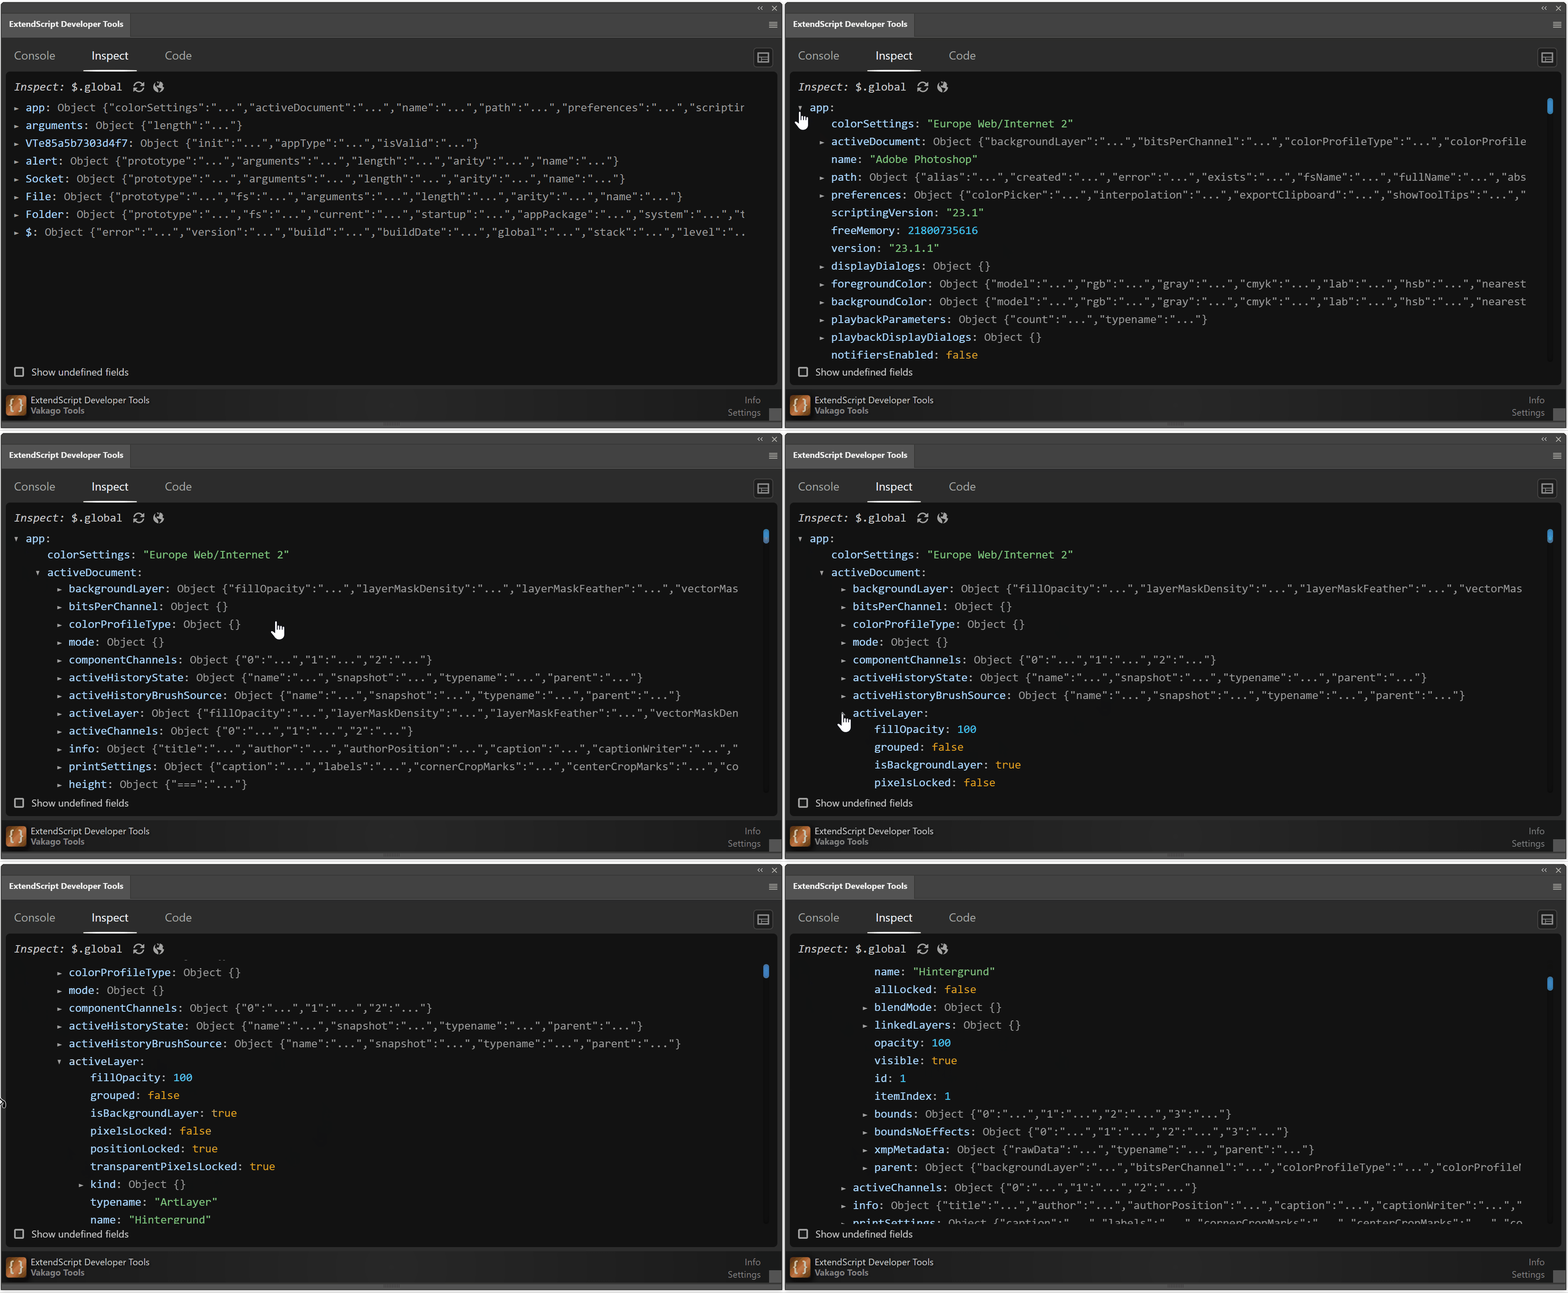
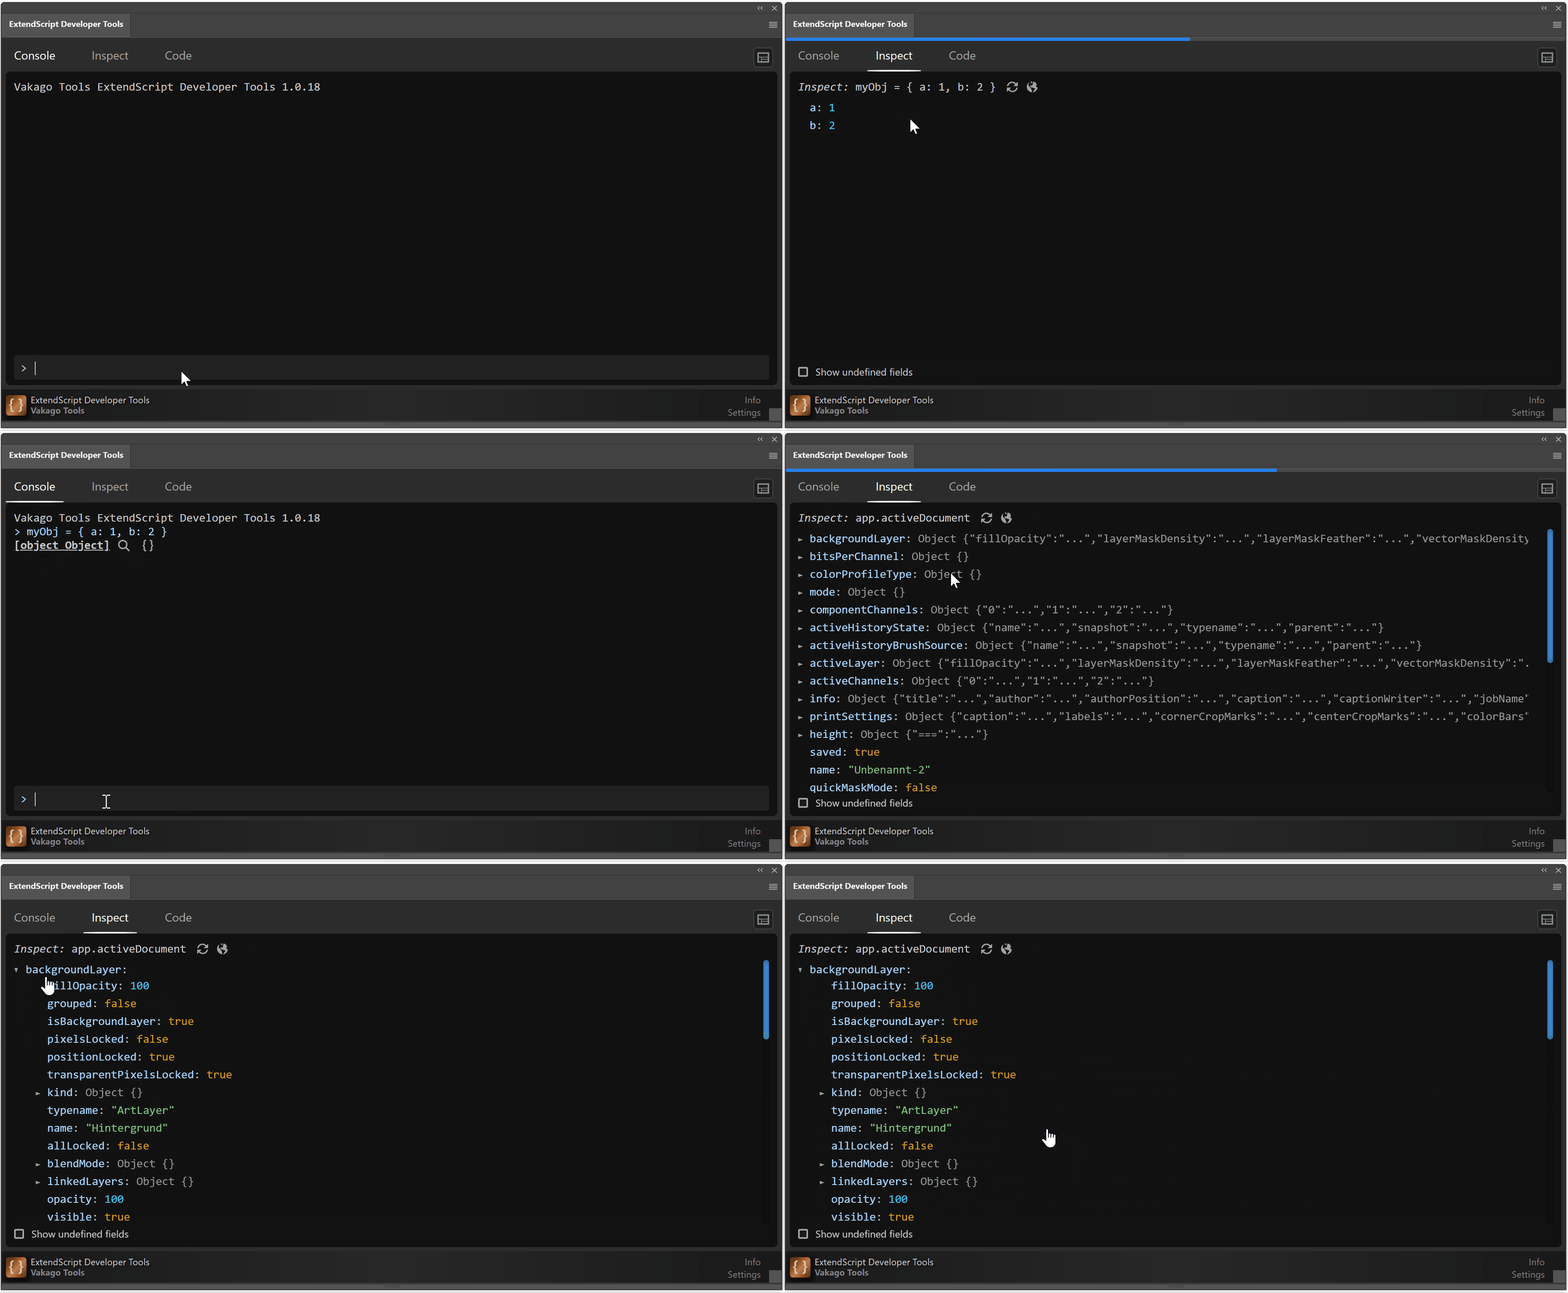
By swiching to the Inspect tab you can inspect all fields in the global namespace ($.global) of the Adobe application you are developing for. Below you can see how this is used to learn more about the structure of the app object. As you can see the tool can be used to understand which information can be retrieved from the activeLayer field. By entering the respective commands in the console you can easily change layer settings such as the opacity, name, blend mode, etc.
You can also inspect any object that is visible in the console. For example when calling qe.project.getActiveSequence() in Adobe Premiere Pro you can simply click on the inspect icon next to the returned object to inspect it. In the gif below you can see how an object created from console is inspected in the inspector:
Code Editor
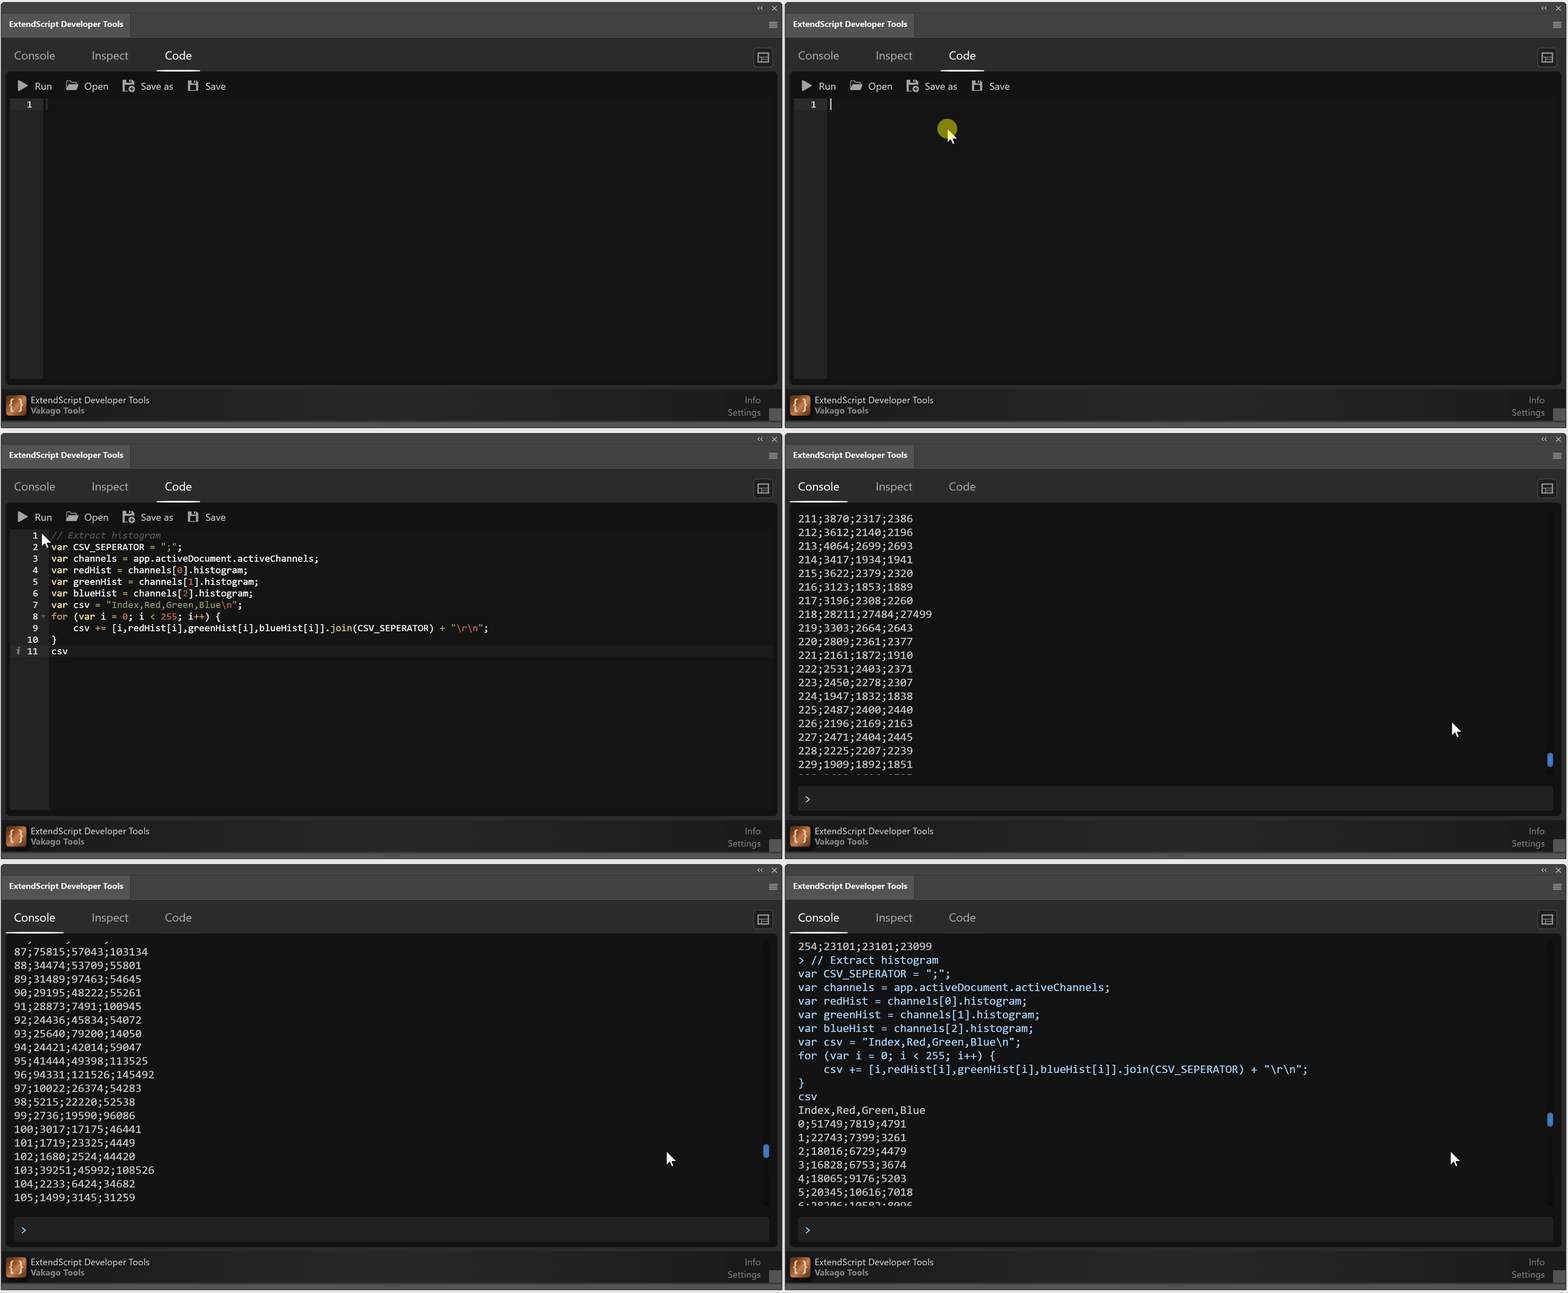
The ExtendScript Developer Tools include a simple code editor that allows you to load and run custom ExtendScript files (JSX files). You can inspect variables and results that are generated when running code from the code editor in the inspect tab.
You can learn more about this extension here: ExtendScript Developer Tools or you can download it from Adobe Exchange.

